Using zustand in react - performance pains
In this series
- Using zustand in react - performance pains
- Using zustand in react - performance gains (Pt. 1)
- Using zustand in react - performance gains (Pt. 2)
React you probably have heard about. Zustand (German for state) is a small library that smushes together state and actions and reducers and thunks (to use lingo from redux) into one store and gives you a react hook to use it. The resulting code maybe isn’t for the purists among us but results in relatively compact stores that are easy to maintain and reason about. Even so, the documentation around zustand isn’t its strong suit, so let’s write a little bit about it.
For this and the follow-up posts I’ll be using a little playground project located at github.
Let’s start with the data we’ll be using for the posts:
The data consists of some header and items. You have to pound a modern ui library badly to get noticeable lags, so I bumped the item count to 4’000 - now, the UI is still pretty usable but with some sensitive, um senses you will notice that it isn’t as snappy and fluid as it should be (note that I’m working on a M1 MBPro, so your mileage may vary).
We then have a store, which will allow editing something on the header as well as checking and unchecking one of the many items:
From zustand you get a get and a set with which you can read and mutate the store. useAppStore is now a hook which you can use in your code. Here is the example from the Header component, the one that allows you to modify the contents of the header.
In line 6 we pull the header data as well as the changeHeader method from the store and connect it to react elements. There is similar code at the Item react component, which allows the user to toggle the rendered checkbox:
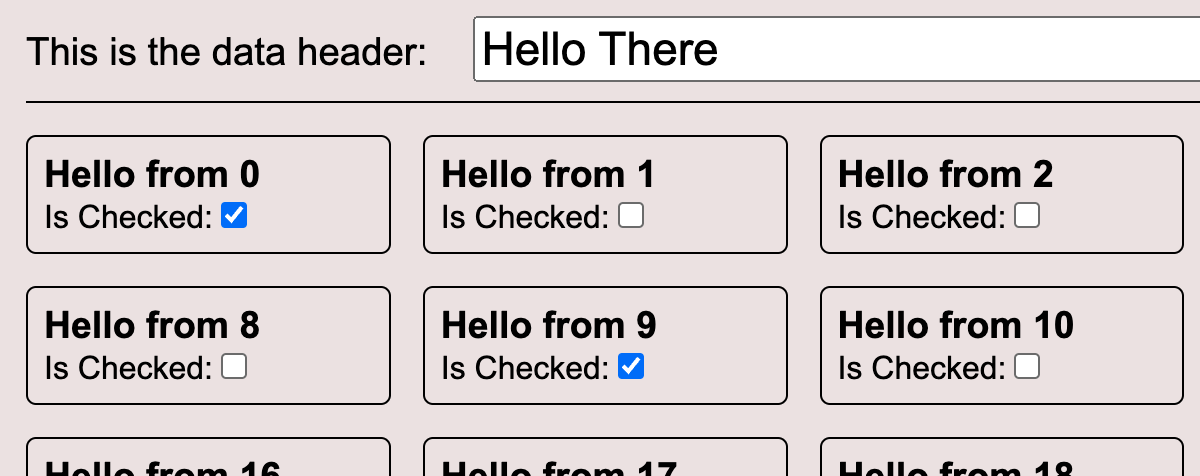
The app itself looks perfectly ordinary, like any unloved LoB-App, really.

In order to see what impact to the application’s performance this way of using the store has, let’s start the react profiler (which is available as e.g. a Chrome plugin) and replace the word “there” with “World”.
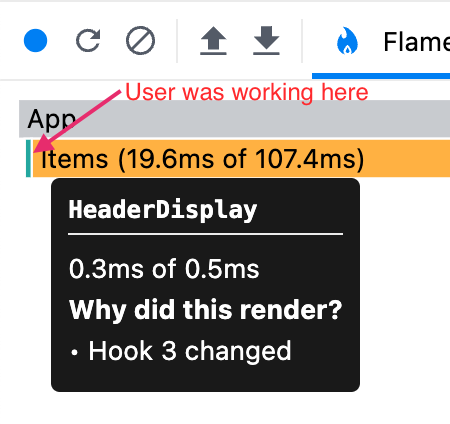
With the profiler running you will now notice a certain lag. The app will render 5 times, once for each user interaction (typing a letter). Once you look at the profile session, you will see that the app was mostly busy with rendering the 4’000 items while your actual interaction only took a minuscule amount of CPU power:

How we can remedy that we will see in the next post.