☁️ Agnostic – Intermezzo: Insightful spans with OpenTelemetry
Cloud agnostic series
- Depending on a colour
- Depending on a colour Pt. 2 - Needs, Possibilities and Limitations
- Cloud Agnostic - introducing the AheadDockerized .NET Solution
- ☁️ Agnostic - Storing & serving files
- ☁️ Agnostic - Messaging between servers with RabbitMQ (Queueing)
- ☁️ Agnostic – Messaging between servers with RabbitMQ (Publish/Subscribe)
- ☁️ Agnostic – Intermezzo: Insightful spans with OpenTelemetry
- ☁️ Agnostic – On gremlins and graphs
Let’s take a short break from looking at service replacements and marvel at the fun that is having good OpenTelemetry data.
When we started ahead many years, OpenTelemetry didn’t exist yet. Aspire leans into it quite nicely, providing a dashboard in which captured open telemetry data is seen.
When you start a project from scratch, you may miss exposing open telemetry from your project. This is done through
some adequate service registrations, which in the solution I have galvanized into
a IHostApplicationBuilder extension method to be found here.
Much of what is encoded there comes directly from the official documentation.
The next challenge was seeing traces that span Frontend and Backend activities when it is correct to do so.
I wasn’t quite sure what is going on with OTel support around RabbitMQ, so I decided to do the necessary boilerplate myself.
What I do on the sending side e.g. when enqueueing a message is to create a new Activity:
Gist not showing up? Most likely you're using Chrome. Reload the page to see the gist.
Let us revisit the sending of the message to RabbitMQ. We will send telemetry information alongside the message in the headers of the message:
What happens in TryInjectTraceContextIntoDictionary? Let’s take a look:
The TraceContextPropagator is a helper class from the OpenTelemetry package(s). It helps to inject the proper
information into the headers of the message which we will use on the “other side” to attach ourselves to the correct trace context:
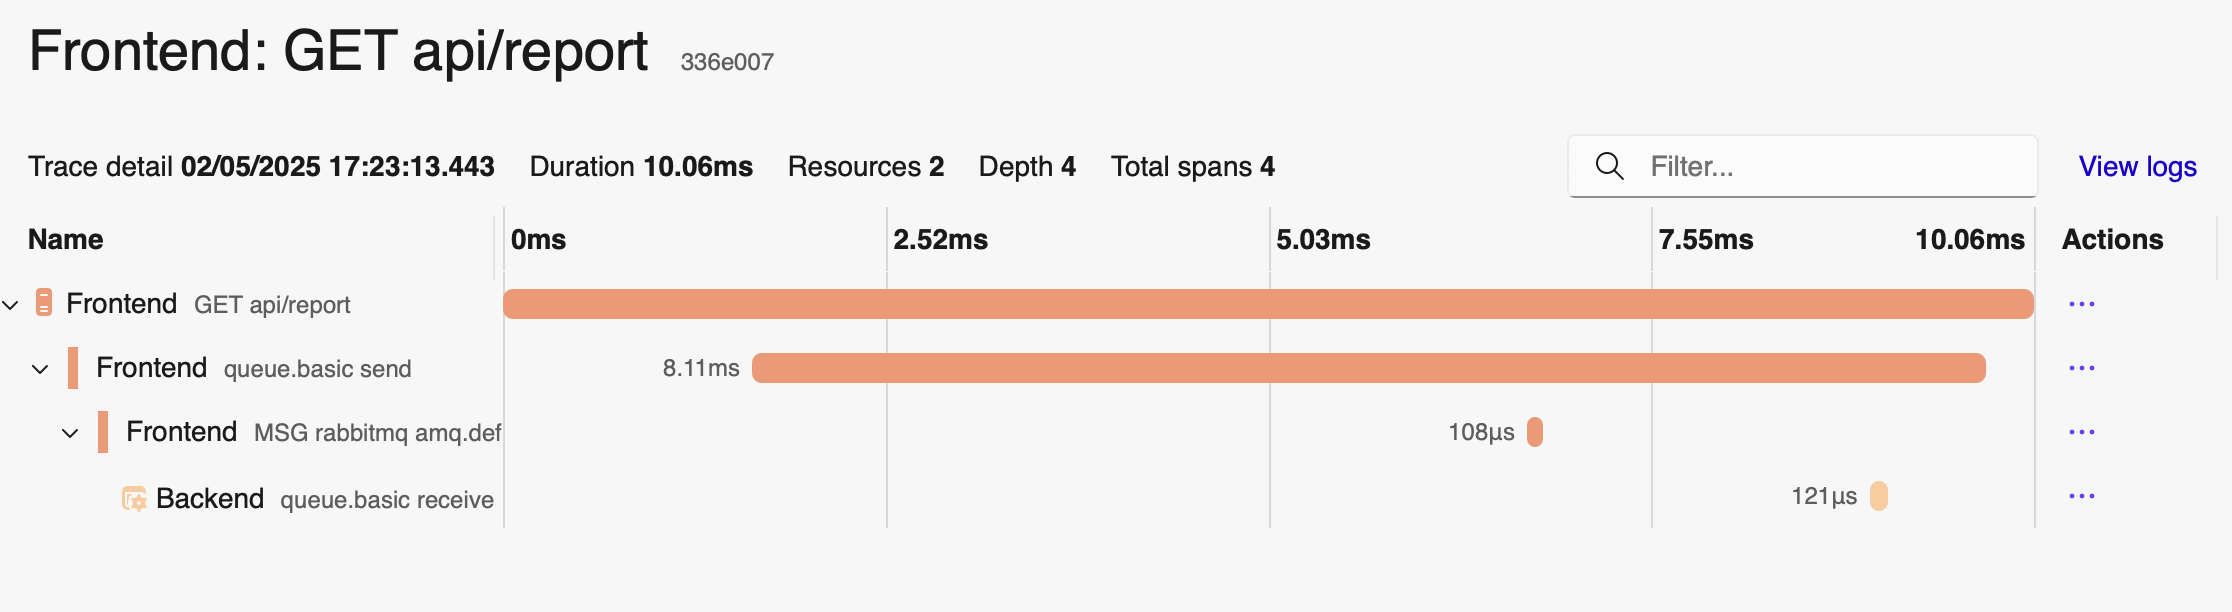
This allows us to get traces that span our projects and provide us additional insights into what is going on:
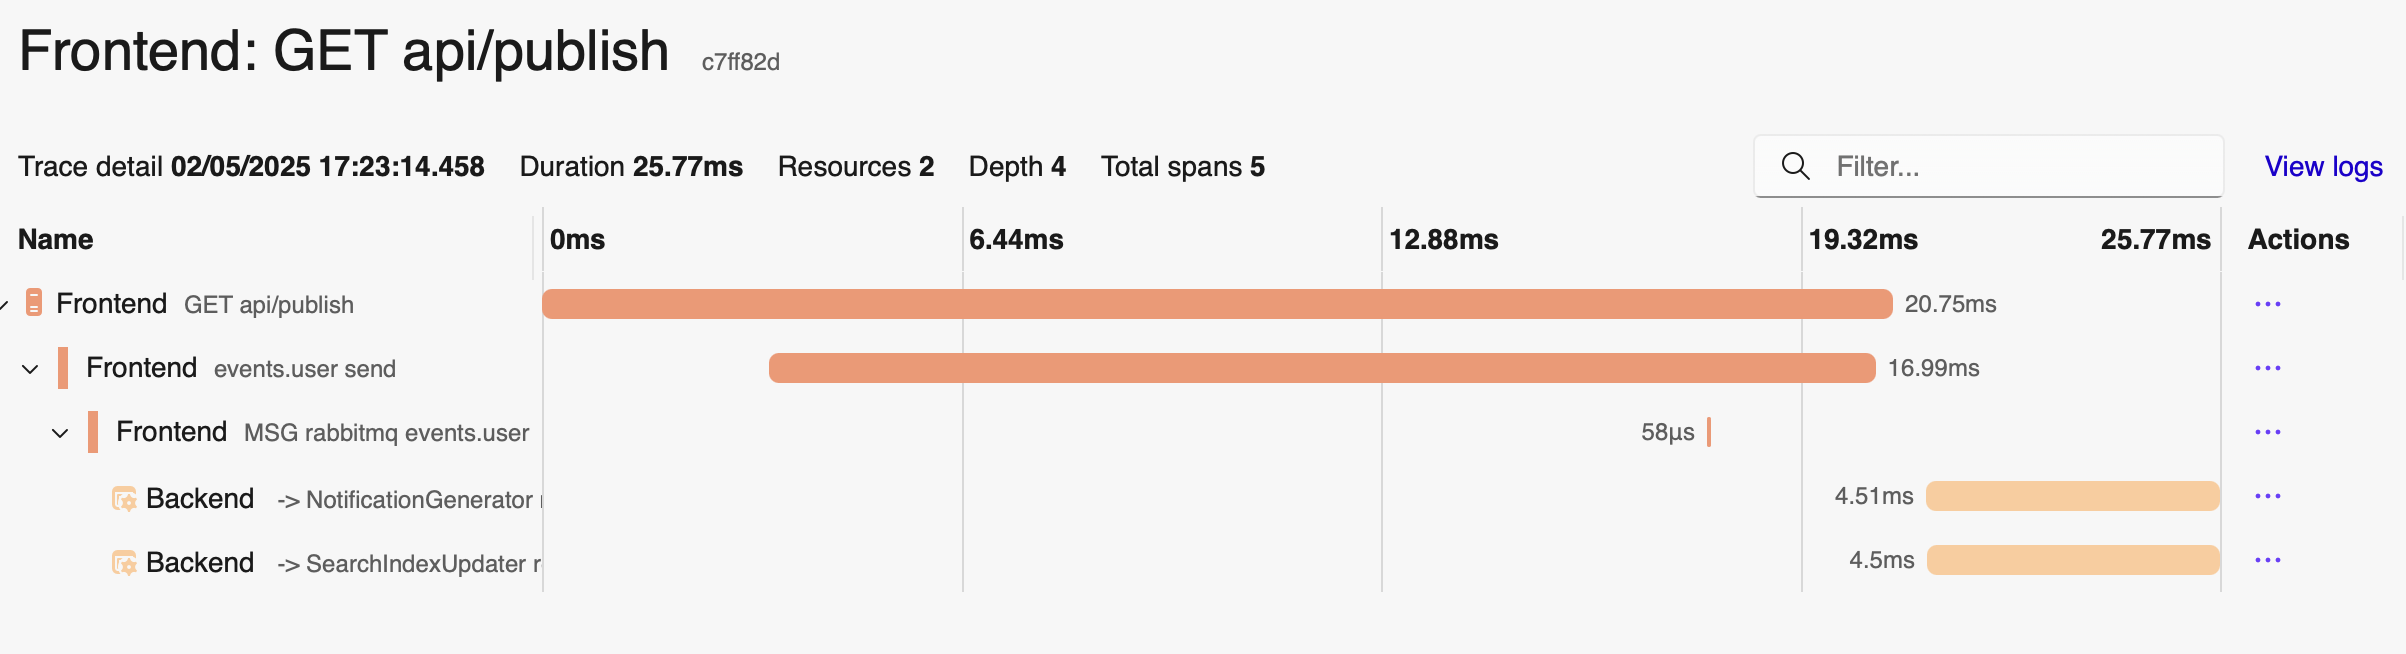
Essentially the same was done for the Broadcasting part, which allows us to see who consumed a particular broadcast message:
When having a solution spanning multiple processes these insights are extremely valuable in understanding the internal workings of the machine you’re creating – a machine that will inevitably increase in complexity as your product grows to be successful with your customers.